CommentsVOICES-Every 10 years following the U.S. Census -- the Los Angeles City Administrative Code, adhering to the California State Constitution -- requires that city council district boundaries be redrawn to substantially equal each other in population for fair constituent representation.
In addition, the Los Angeles City Council Redistricting Commission (LACCRC) -- following the guidelines of the LA City Charter and state constitution in formation and purpose -- is required to “allocate constituents proportionately while also accounting for the unique histories, experiences and interests of communities, such that those interests will have the highest probability of being served by elected representatives and the City of Los Angeles.”
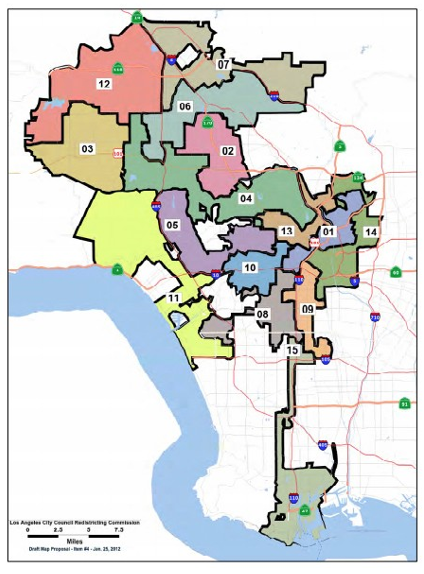
To understand the concept of redistricting, I perused the Los Angeles Engineering’s city council districts maps (Maps) – copyrighted 1972, 1987, 2002, 2011, and 2020 -- and found striking patterns of movement and change appearing in every succeeding map compared with earlier maps. District boundaries expanded or contracted; Districts relocated across the city or shifted leaving behind former neighborhoods to nearby Districts requiring boundary expansion; lastly, some Districts stretched irregularly to embrace distant neighborhoods only to meet their allocations.
 In 2011, Wendell Cox, in New Geography, calculated the population growth in the City of Los Angeles between 2000 and 2010, based on Census Bureau Data. He identified the growth as taking place in the outer boundaries of the city: The San Fernando Valley “captured 70 percent of the city’s growth in the 2000s,” noticeably in the hills north of Chatsworth and Northridge; the coastal area extending from the Santa Monica Mountains to Westchester accounted for 13 percent of the city’s growth; and, the Harbor area accounted for five percent of the city’s growth.
Wendell Cox’s narrative is reflected in the Council Districts’ 2010 Map that captures the relocation of District 6 to the northeast San Fernando Valley as well as the consequent shift of District 11 southwardly from its boundaries along freeway 101 down to the southern boarders of Tarzana and Woodland Hills. From there it stretches down the coast from the Santa Monica Mountains to Venice, Playa del Rey and Westchester, while District 3 stretches southward to include the neighborhoods of Tarzana and Woodland Hills. Encino connects with Bel-Air to be part of District 5.
Then by the 2020 Map, District 12 expands its boundaries to include the neighborhood of West Hills while letting go a part of Balboa as District 3 includes more of Canoga Park.
Unlike most of LA council districts, the boundaries of District 15 are restricted since they border other municipalities and thus the area can only get denser. District 15’s most northerly neighborhood is Watts, then the district stretches southward via the Harbor Gateways to the coastal neighborhoods of Harbor City, Wilmington and the Port of Los Angeles at San Pedro. According to en.m.Wikipedia.org, District 15 is the only district to maintain its boundaries generally the same since the formation of the council districts in 1925.
The Controller’s dataset, with references to the 2013 U.S. Census, submitted by Beacon Economics “as of 4/11/17”, matches Wendell Cox’s (2011) narrative and statistical analysis of “population growth in the city between 2000 and 2010” especially in Districts 11, 12, and 15.
It shows, District 11 accounting for the highest population in the city with 289,385 people; the second highest is District 12 with 284,395; and the third highest is District 15 with 275,486 people. The median of the populations is 258,000 (District 6). District 11’s calculated population is 31,385 above the median, and accounts for 52,507 more people than District 14 with the lowest population in central Los Angeles.
However, LA County’s 2018 data pertaining to the populations of LA City Council Districts goes contrary to the 2013 Controller’s data.
This county profile ranks District 9 in central Los Angeles as having the highest population in the city with 285,373 residents. District 6 in the northeast San Fernando Valley accounts for the second highest population with 283,654 residents, and District 7 accounts for the third highest population with 278,658 people. Interestingly, between 2013 and 2018 there was not a census count, could it be that the City Controller’s data is a result of the 2010 census count and the 2018 data from L.A. County be an independent count?
Though, Wendell Cox’s (2011) article states that central Los Angeles grew only by 12,000 people between 2000-2010, he also says, “the central area is very densely populated at approximately 14,000 people per square mile, with the highest density census tracts having more than 90,000 residents per square mile.” Further, he states that among the nation’s largest municipalities, only New York and San Francisco are denser than central Los Angeles.
Moreover, LA Times maps shows that Panorama City accounted for a population of 65,766 in 2000 according to the U.S. Census and 69,630 residents were counted in 2008, based on LA Department of City Planning estimates. Panorama City is presently a neighborhood in District 6 with an area of 3.65 square miles. As a result, there are 18,028 people per square mile. These are among the highest densities for the city of Los Angeles and among the highest densities for the county.
If the City of Los Angeles were to account for a far lower population than in previous decades when the 2020 U.S. Census numbers come out on August 15, we must not forget the affordable housing crunch due to the Ellis Act. For two decades, steadfast, according to the Coalition for Economic Survival, from January 1, 2001 to 2020, landlords and/or developers filed Ellis Act Declarations with the City of Los Angeles to evict 27,127 tenants from their affordable residential units.
Lastly, Fred Ali Chair of the Los Angeles City Council Redistricting Commission (LACCRC), announced that presently no maps have been drawn or released by LACCRC and that map drafts will become available in September at which time the community will be able to respond and provide comments.
(Connie Acosta is a writer who researches and reports on Proposition HHH Projects and participates in the City of Los Angeles Neighborhood Council System.) Photo: Keith Birmingham/Credit: Pasadena Star-News. Edited for CityWatch by Linda Abrams.


