WHAT THEY’RE SAYING--If you’re like me, you spent the weekend depressed after reading Nate Cohn’s column in The New York Times or David Wasserman’s post on the NBC website.
In each, the two data science-focused reporters looked at the Presidential election polling. Rather than simply looking at the national results, they considered the state by state results and analyzed what these results mean for the election.
The results of their analysis was shocking. While Trump’s negative ratings on a national level seem to make his re-election unlikely, their state-by-state analysis indicated that there was a path for Trump to repeat his narrow electoral college win of 2016, this time while losing the popular vote by as many as five million ballots.
As a result, if the Democrat wins California by 1 vote or 3 million, he or she still gets all 55 electoral votes. Similarly, if Trump wins Texas by 1.5 million votes or by 1 vote, he gets all 38 electoral votes.
Texas and California are relevant since they are the nation’s two most populous states, and they are unlikely to vote for the Republican, in California’s case, or the Democrat, in Texas.
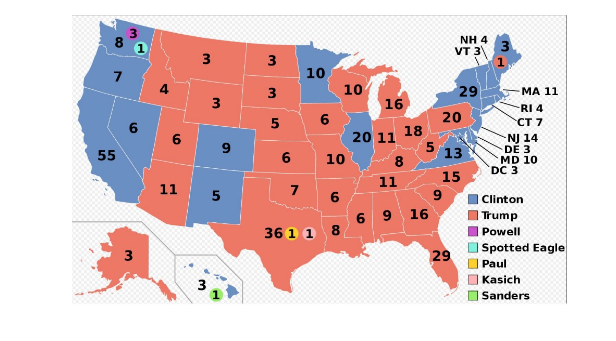
That’s where the idea of “swing states” comes in. In 2016, Trump won 3 midwestern states by less than one percentage point: Pennsylvania, Michigan and Wisconsin. Indeed, Michigan’s 0.23 percentage point victory was so close, just 10,704 out of a total 4,799,284 cast, that it took days to determine the final winner. Indeed, Jill Stein’s 51,463 votes might have made the difference.
Despite such a small margin, Trump won all 16 of Michigan’s electoral votes. The same can be said for Pennsylvania’s 20 electoral votes and Wisconsin’s ten.

2016 election results. By Gage — 2012 Electoral College map, CC BY-SA 4.0,
Remember that Trump won the electoral college by a margin of 306 to 232, a difference of 74 electors. If those three states had voted Democratic, a change of less than 39,000 votes out of nearly 137 million cast, Clinton would have won the election. (Read the rest.)
-cw


